![40+ Key Amazon Statistics You Need to Know [2026]](https://jobera.com/resources/wp-content/uploads/2024/06/amazon.webp)
Curious about what makes Amazon, ‘The Amazon’?
Amazon.com receives over two billion visitors each month.
Amazon Prime has 230 million annual subscribers as of 2023.
80% of people choose Amazon due to fast and free shipping.
Amazon is selling for $4,722 per second, with sales amounting to $283,000 per minute.
Ready to ride the Amazon wave?
Uncover the secrets of Amazon’s success with eye-opening statistics.
Top Amazon Statistics: Editor’s Pick

- Amazon’s net revenue was $513.98 billion in 2022, increasing to $554.02 billion in 2023. [2]
- Amazon Web Services (AWS) was responsible for 15% of Amazon’s revenue. [2].
- Amazon reported a net profit of $30.4 billion in 2023. [3]
- There were 350,000 sellers worldwide with over $100,000 in sales on Amazon in 2021. [5]
- Approximately 73% of Amazon sellers reported making a profit margin of more than 10%. [5]
- As of 2023, the Amazon Appstore boasts 513,494 apps. [8]
- 69% of people buy on Amazon because it offers a wide variety of products. [9]
- 66% of people shop on Amazon due to a desire to use Prime membership. [9]
- 49% admitted Amazon has the best prices. [9]
- 44% prefer Amazon due to its easy return policy and process. [9]
General Amazon Statistics
Amazon was launched in July 1994. [3]
Amazon’s headquarters are located in Seattle, Washington. [3]
Amazon.com is a highly visited site receiving over two billion visitors each month. [1]
It is the 4th most popular site in the US and 13th most popular site worldwide. [1]
Amazon has over 310 million active users worldwide. [1]
And nearly 80% of these users come from the US. [1]
Amazon Revenue Statistics
Talking about Amazon revenue, it is the third largest public company.
Amazon’s net revenue was $513.98 billion in 2022. [2]
Amazon’s net revenue increased to $554.02 billion in 2023. [2]
Amazon web services was responsible for 15% of that revenue. [2]
Amazon annual revenue 2005 to 2023 ($ billion)
| Year | Revenue ($bn) |
|---|---|
| 2005 | 8.4 |
| 2006 | 10.7 |
| 2007 | 14.8 |
| 2008 | 19.1 |
| 2009 | 24.5 |
| 2010 | 34.2 |
| 2011 | 48 |
| 2012 | 61 |
| 2013 | 74.4 |
| 2014 | 88.9 |
| 2015 | 107 |
| 2016 | 135.9 |
| 2017 | 177.8 |
| 2018 | 232.8 |
| 2019 | 280.5 |
| 2020 | 386 |
| 2021 | 470.8 |
| 2022 | 513.9 |
| 2023 | 574.9 |
Amazon revenue breakdown 2014 to 2023 ($ billion)
| Year | Online stores | Physical stores | Third-party retail | Subscription services | AWS | Advertising | Other |
|---|---|---|---|---|---|---|---|
| 2014 | 68.5 | – | 11.7 | 2.7 | 4.6 | – | 1.3 |
| 2015 | 76.8 | – | 16 | 4.4 | 7.8 | – | 1.7 |
| 2016 | 91.4 | – | 22.9 | 6.3 | 12.2 | – | 2.9 |
| 2017 | 108.3 | 5.8 | 31.8 | 9.7 | 17.4 | – | 4.6 |
| 2018 | 122.9 | 17.2 | 42.7 | 14.1 | 25.6 | – | 10.1 |
| 2019 | 141.2 | 17.1 | 53.7 | 19.2 | 35 | – | 14 |
| 2020 | 197.2 | 16.2 | 80.4 | 25.2 | 45.3 | 15.5 | 5.9 |
| 2021 | 222 | 17 | 103.3 | 31.7 | 62.2 | 31.1 | 3.4 |
| 2022 | 220 | 18.9 | 117.7 | 35.2 | 80 | 37.7 | 4.2 |
| 2023 | 231.8 | 20 | 140 | 40.2 | 90.7 | 46.9 | 4.9 |
Amazon Profit and Valuation Statistics
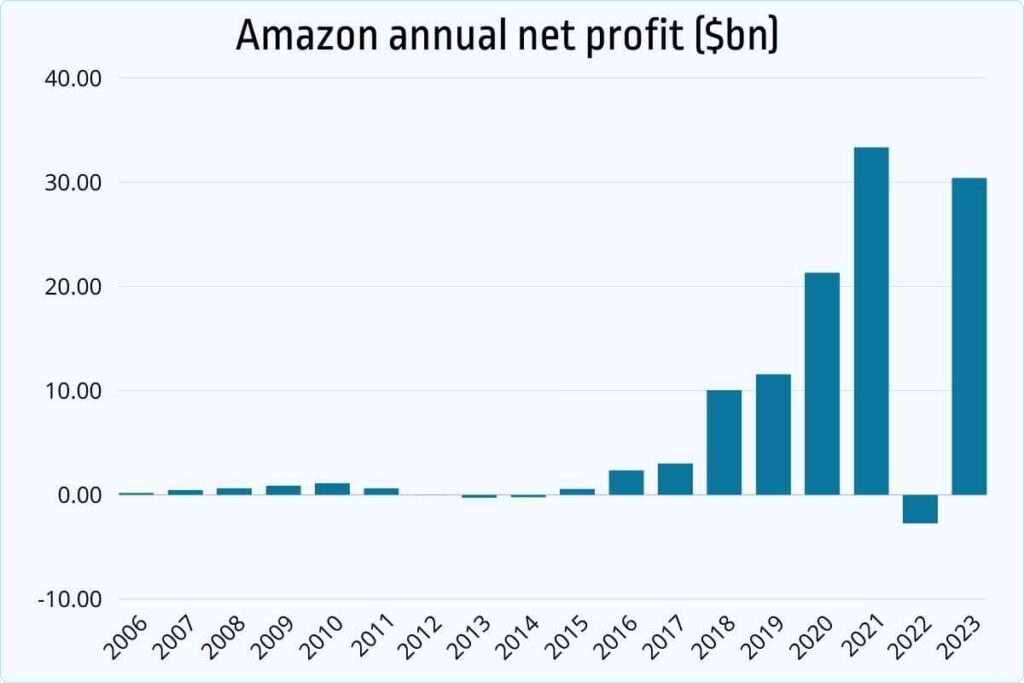
Amazon reported a net profit of $30.4 billion in 2023. [3]
Amazon recorded $0.35 billion net profit in 2005. [3]
Here we have recorded Amazon net profit from 2005 to 2022.
| Year | Profit ($bn) |
|---|---|
| 2005 | 0.35 |
| 2006 | 0.19 |
| 2007 | 0.47 |
| 2008 | 0.64 |
| 2009 | 0.9 |
| 2010 | 1.15 |
| 2011 | 0.63 |
| 2012 | -0.03 |
| 2013 | -0.27 |
| 2014 | -0.24 |
| 2015 | 0.59 |
| 2016 | 2.37 |
| 2017 | 3.03 |
| 2018 | 10.07 |
| 2019 | 11.58 |
| 2020 | 21.33 |
| 2021 | 33.36 |
| 2022 | -2.72 |
| 2023 | 30.42 |
Amazon Prime Members Statistics
Amazon Prime has 230 million annual subscribers as of 2023. [6]
Amazon Prime’s annual subscribers increased from 150 million in 2020 to 213 in 2022. [6]
Amazon Prime has 165 million subscribers in the US alone as of 2023. [7]
| Year | Subscribers (mm) |
|---|---|
| 2016 | 46 |
| 2017 | 66 |
| 2018 | 100 |
| 2019 | 120 |
| 2020 | 150 |
| 2021 | 200 |
| 2022 | 213 |
| 2023 | 230 |
Amazon Sales and Shipping Statistics
Amazon is selling for $4,722 per second. Each minute, those sales amount to $283,000. [4]
According to Amazon’s reports, there were 350,000 sellers worldwide with over $100,000 in sales in 2021 which increased by over 55% from 225,000 in 2019. [5]
Nearly three-quarters of Amazon sellers (73%) reported making a profit margin of more than 10%.
Approximately 86% of sellers opt for Fulfillment by Amazon (FBA) as their chosen method of selling.
Amazon Appstore
Ever visited the Amazon app store?
The number of apps is significantly increasing on the Amazon app store.
As of 2023, Amazon has 513,494 apps. [8]
Number of apps in the Amazon Appstore 2015 to 2023
| Year | Available apps |
|---|---|
| 2015 | 299,793 |
| 2016 | 394,024 |
| 2017 | 377,295 |
| 2018 | 432,900 |
| 2019 | 475,617 |
| 2020 | 488,674 |
| 2021 | 460,619 |
| 2022 | 480,174 |
| 2023 | 513,494 |
Amazon Statistics By Shoppers
When asked, “Why do you shop on Amazon?”, Statista found these reasons:
- 80% of people choose Amazon due to fast and free shipping. [9]
- 69% of people buy on Amazon because it offers a wide variety of products.
- 66% of people shop on Amazon due to a desire to use Prime membership.
- 49% admitted Amazon has the best prices.
- 44% prefer Amazon due to its easy return policy and process.
Amazon Trends & Facts
Which item has generated the most sales?
According to AMZScout PRO Extension, Ice and Water Refrigerator Filter generates more sales than any other item, with over 166,000 orders per month. [10]
Most of Amazon’s brands are focused on the following categories:
- Clothing, Shoes, & Jewelry: 41% [10]
- Electronics: 36%
- Home & Kitchen: 30%
- Cell Phones & Accessories: 29%
- Beauty and Personal Care: 29%
- Grocery & Gourmet Food: 28%
If you found this article interesting, you might enjoy these too:
FAQs
How many visitors does Amazon receive each month?
Amazon.com receives over two billion visitors each month, making it one of the most visited sites globally.
What percentage of Amazon’s revenue comes from Amazon Web Services (AWS)?
AWS contributes to approximately 15% of Amazon’s total revenue, highlighting its significance as a revenue stream.
How many subscribers does Amazon Prime have?
As of 2023, Amazon Prime boasts 230 million annual subscribers worldwide, with 165 million in the US alone.
What are the top reasons people shop on Amazon?
The main reasons people shop on Amazon include fast and free shipping (80%), a wide variety of products (69%), and the convenience of Prime membership (66%).
What is Amazon’s market cap?
Amazon’s market cap varies and is subject to change based on stock prices and other factors. As of the latest available data, Amazon is one of the world’s most valuable companies, with a market cap in the hundreds of billions of dollars.
Conclusion
With its massive visitor numbers, diverse revenue streams, extensive Prime membership base, and wide array of products, Amazon remains a dominant force in the e-commerce landscape, shaping shopping habits worldwide.
Sources
- Similarweb. amazon.com overview
- Companies market cap. Amazon’s revenue
- Business of Apps. Amazon Statistics 2024
- Repricerexpress. Amazon Statistics
- Marketplace Pulse. Amazon Revenue and facts
- Vox. Amazon Prime members worldwide
- CIRP. Amazon Report Michael Levin and Josh Lowitz
- Appfigures. App Analytics for the Amazon Appstore
- Statista. Amazon Usage in US
- Amzscout. Amazon Statistics

Manisha Saini is a digital writer and career advisor at Jobera. She creates research-based content on job search trends, personal branding, and career growth, helping professionals make better career decisions.