![40+ American Savings Statistics & Trends [2026]](https://jobera.com/resources/wp-content/uploads/2024/04/savings.webp)
Am I saving enough?
We all go to this question every now and then!
It is to be noted that 10% of Americans have no savings.
24% of Americans have not saved any money for emergencies.
It is concerning to note that 50% of women have no retirement savings by the age of 55 to 66.
And 80% of women live impoverished even when they retire.
66% of Americans were able to save more money in 2023 due to increased interest rates and pay raises.
Ready to delve deeper into savings statistics, facts, and trends in the US? Let’s begin!
Top American Savings Statistics: Editor’s Pick

- 71% of Americans have a savings account. [12]
- 58% of Americans have less than $5,000 in savings. [12]
- Americans aged 75+ have the highest savings of about $60,410. [13]
- Households with an average income above $90k had the highest median savings. [8]
- US BEA estimated the District of Columbia would save $2,806 per capita in 2022. [6]
- The least savings were estimated for Mississippi with $1,508 per capita in 2022. [6]
- An average American is saving about $5000 or less for emergencies. [5]
- 13% of Americans over 60 have no retirement savings. [3]
- 47% of people are saving for their retirement but not into retirement accounts. [3]
General American Savings Statistics
Amount of balance in an average American’s savings account?
Overall US personal savings amounted to $802.1 billion as of April 2023. [2]
If we include retirement assets in savings, an average American has $65,100 in savings. [2]
71% of Americans have a savings account. [12]
It is to be noted that 10% of Americans have no savings. [12]
58% of Americans have less than $5,000 in savings. [12]
| Average savings amount | Percentage of Americans |
|---|---|
| Less than $1,000 | 42% |
| $1,000-$5,000 | 16% |
| $5,000-$10,000 | 9% |
| $10,000-$25,000 | 8% |
| $25,000-$50,000 | 5% |
| $50,000+ | 20% |
American Savings By Demographics
It isn’t surprising that people aged below 35 have the least savings. Why?
Because they are either still in college or have entered the workforce and figuring it out.
Americans aged 75+ have the highest savings of about $60,410. [13]
People aged between 35 to 44 have reported saving around $27,910 on average. [13]
People with college degrees have reported to be saving an average of $78,890. [13]
While high school diploma holders save about $20,100, no high school diploma holders make about $9,190. [13]
Average Savings by Gender & Race
It is concerning to note that 50% of women have no retirement savings by the age of 55 to 66. [10]
And 80% of women live impoverished even when they retire. [10]
62% of American women have less than $1,000 in savings compared to 17% of men. [11]
There is an evident disparity between different races and ethnic groups.
| Race/Ethnicity | Median net worth amount | Average net worth amount |
|---|---|---|
| White | $189,100 | $980,550 |
| Black | $24,100 | $142,330 |
| Hispanic | $36,050 | $165,540 |
| Other | $74,500 | $656,600 |
The median household income for white, non-Hispanic households was still significantly higher, at $76,057, than African-American households, at 46,073, and Hispanic households, at $56,113. [9]
Average American Savings By Income
There should not be any doubt in the fact that income significantly affects savings.
| Income | Median amount | Average amount |
|---|---|---|
| Less than $20,000 | $810 | $8,400 |
| $20,000 to $39,900 | $2,050 | $11,260 |
| $40,000 to $59,900 | $4,320 | $16,390 |
| $60,000 to $79,900 | $10,000 | $28,680 |
| $80,000 to $89,900 | $20,000 | $51,840 |
| $90,000 to $100,000 | $70,000 | $229,030 |
- Households with an average income above $90k had the highest median savings. [8]
- The households with income between $90k to $100k save an average amount of $229,030.
- Comparatively, households with incomes between $80k and 89k save around $51,840.
Noticed the huge gap?
Average Savings By State
Does where you live impact your saving habits?
Expert opinion, YES!
According to a Forbes Advisor study of the worst and best states to save, Northeastern states are the most difficult to save money, while Midwest states are some of the easiest. [6]
Here we have curated a list of states saving the least and most money.
| States Saving the Most Money | States Saving the Least Money |
|---|---|
| District of Columbia | Arkansas |
| Massachusetts | Kentucky |
| Connecticut | Alabama |
| New Jersey | West Virginia |
| Washington | Mississippi |
It is to be noted that the states saving the least money are not the states where it is difficult to save money.
| Worst states for saving money | Best states for saving money |
|---|---|
| Hawaii | North Dakota |
| California | South Dakota |
| Maryland | West Virginia |
| New York | Missouri |
| New Jersey | Ohio |
US BEA estimated the District of Columbia would save $2,806 per capita in 2022. [6]
The least savings were estimated for Mississippi with $1,508 per capita in 2022. [6]
Emergency Savings Statistics
Are Americans prepared for emergencies?
According to a study by CFPB, 24% have not saved any money for emergencies. [4]
37% of Americans admitted to having at least a month’s worth of income in emergency savings. [4]
While 39% of people even reported saving less than a month’s funds. [4]
Though it’s not enough, there has been an increase in emergency preparedness in the last decade.
As in 2013, only 50% of people reported that they could cover a small emergency expense using their own money, the percentage increased to 68% in 2021. [3]
Have you set up your emergency fund yet?
How much money should you save for emergencies?
Experts suggest keeping at least three to six months’ worth of living expenses in an emergency fund. [5]
An average American is saving about $5000 or less for emergencies. [5]
The median emergency savings were $5,000 as of late 2021, with over a third (34%) of Americans reporting saving less. [5]
Retirement Savings Statistics
It is shocking to note that 13% of Americans over 60 have no retirement savings. [3]
42% of Americans between 18-29 years of age have no retirement savings. [3]
| Age Group | % of people without retirement savings |
|---|---|
| 18-29 | 42% |
| 30-44 | 26% |
| 45-59 | 17% |
| 60+ | 13% |
An economic well-being survey of US households conducted by the Federal Reserve in 2023 found that 8% of non-retired adults tapped their retirement savings to cover an emergency in 2022. [3]
Types of retirement savings
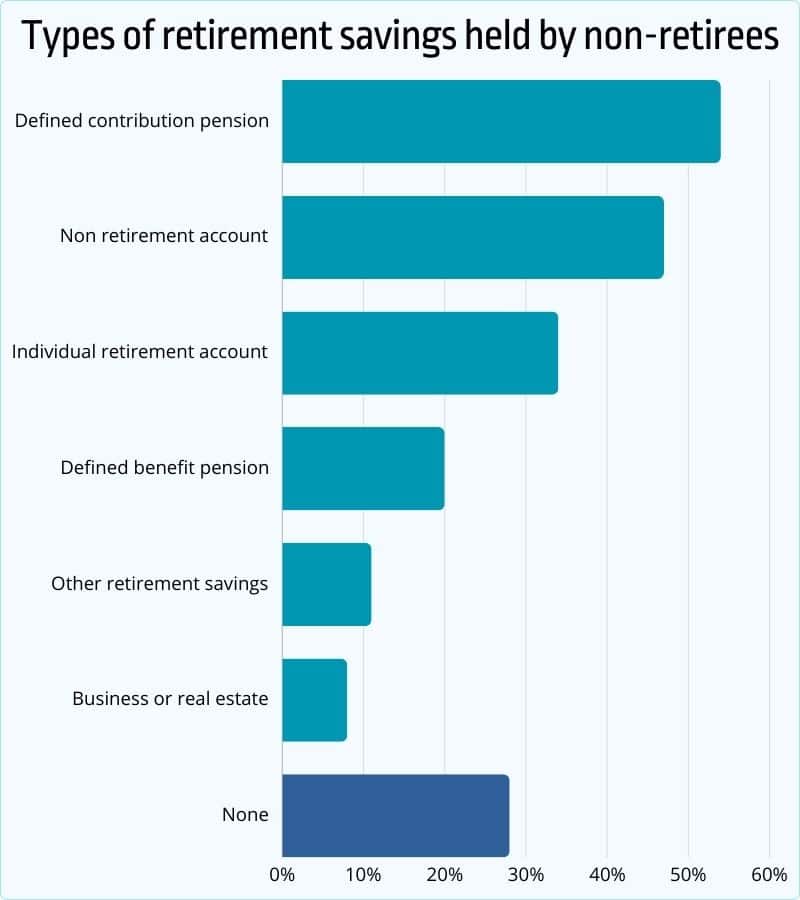
Source: The Federal Reserve
- 47% of people are saving for their retirement but not into retirement accounts. [3]
- 54% of Americans take up a defined contribution pension plan like 401(k) or 403(b).
- 34% have saved up in the individual retirement accounts.
- 8% have saved business or real estate assets for their retirement.
American Savings Trends
According to a Forbes survey, 66% of Americans were able to save more money in 2023. [1]
The following reasons were given by respondents:
- 50% saved more because of increased interest rates. [1]
- 35% of Americans were able to save more due to pay raises.
In recent times, average personal savings in America went highest in 2021, due to the pandemic. [1]
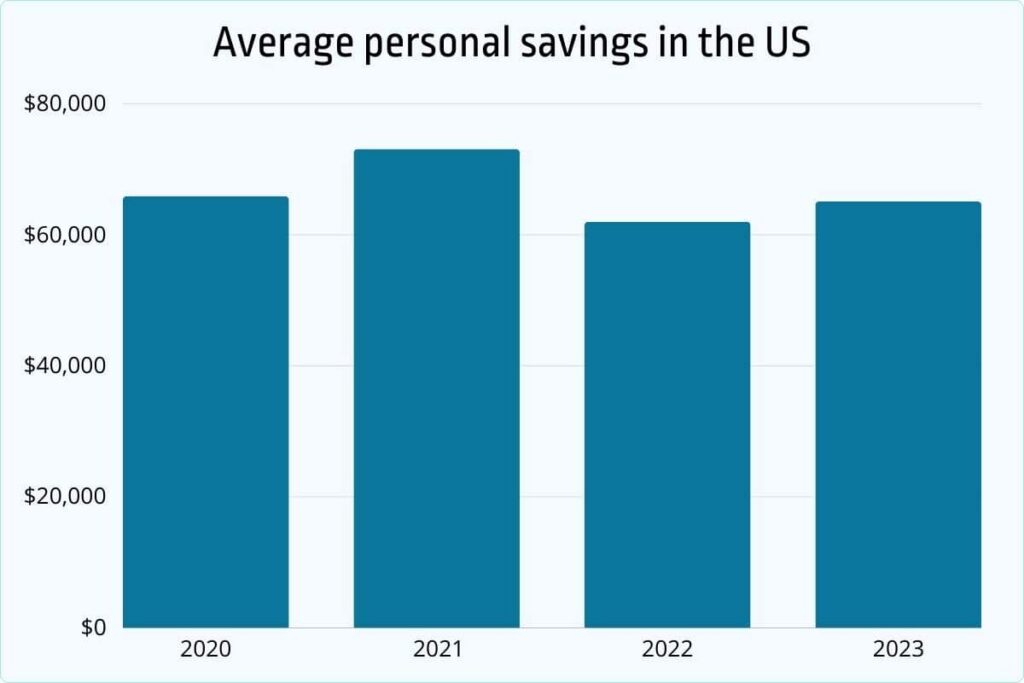
Source: Northwestern Mutual
Are Americans using the interest rate hikes?
According to Northwestern Mutual’s 2023 report Americans are taking following steps to address economic uncertainty:
- Nearly 64% of respondents are cutting costs. [2]
- 50% are building savings
- 41% are delaying large expenses.
Households are utilizing multiple strategies at a time.
If you found this article interesting, you might enjoy these too:
FAQs
How much do Americans typically have in their retirement savings accounts?
As of late 2021, the median emergency savings were $5,000, with over a third (34%) of Americans reporting saving less.
How much should you save at 30?
Financial experts often recommend having the equivalent of your annual salary saved by age 30. However, this can vary depending on individual circumstances and financial goals. A common guideline is to aim to have saved at least half of your annual salary by this age.
How much should you save at 40?
By age 40, it’s generally suggested to have three times your annual salary saved. Again, this is a guideline and may vary based on factors such as lifestyle, retirement goals, and other financial obligations. It’s important to regularly assess and adjust savings goals based on individual circumstances.
Conclusion
By analyzing these statistics, it’s evident that there are disparities in savings across demographics, income levels, and geographic locations in the United States. Understanding these trends can help individuals and policymakers address challenges and implement strategies to promote financial security and stability.
Sources
- Forbes. Best High-Yield Savings Accounts For April 2024
- Northwestern Mutual. Planning & Progress Study 2023
- The Federal Reserve. Economic Well-Being of US Households
- Consumer Financial Protection Bureau (CFPB). Making Ends Meet Survey and Consumer Credit Panel
- TransAmerica. Emergency Savings: Your Key to Financial Resilience
- Forbes Advisor Study. The Worst and Best States to Live in to Save Money
- Statista. Share of adults without retirement savings in the United States as of January 2020, by age group
- Federal Reserve Bulletin. Changes in US Family Finances
- U.S. Census. Working Economics Blog
- Census. Those Who Married Once More Likely Than Others to Have Retirement Savings
- Yahoo. 58% of Americans Have Less Than $1,000 in Savings, Survey Finds
- The Motley Fool. The Percentage of Americans With Less Than $1,000 in Savings Is Shocking
- Timestamped. American savings account balance

Manisha Saini is a digital writer and career advisor at Jobera. She creates research-based content on job search trends, personal branding, and career growth, helping professionals make better career decisions.