![75+ Influencer Marketing Statistics And Trends [2026]](https://jobera.com/resources/wp-content/uploads/2024/03/influencer-marketing.webp)
Wondering how influencers shape the market?
92% of marketers believe that influencer marketing is an effective form of marketing.
About 8% of marketers use Instagram for influencer campaigns, making it the preferred platform for influencer collaborations.
Ever thought about the numbers behind influencer success?
Brands generate $6.50 in revenue for every $1 invested in influencer marketing.
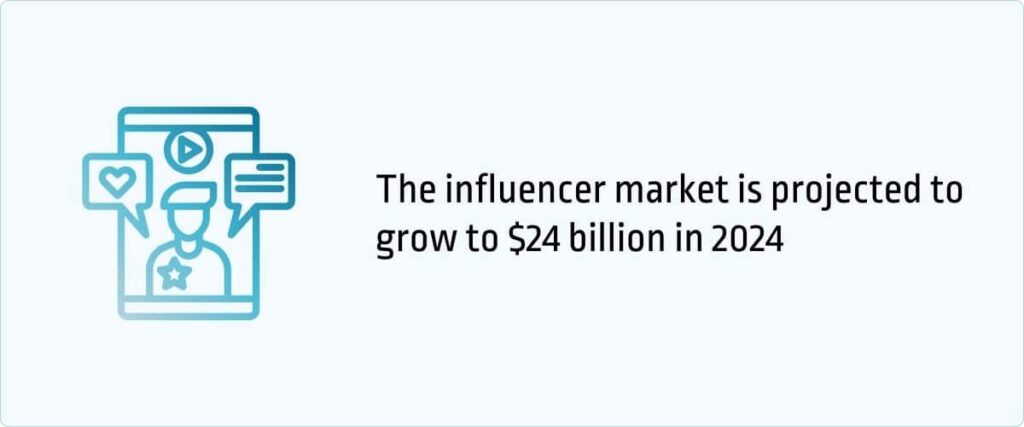
The influencer market is projected to grow to $24 billion in 2024.
Ready to redefine your marketing strategy? Dive into revealing stats on influencer marketing.
Top Influencer Marketing Statistics: Editor’s Pick
- The influencer market surged from $1.7 billion in 2016 to an impressive $16.4 billion in 2022, exhibiting significant growth. [1]
- Instagram, with a 72% usage rate in 2022, dominated as the most-used influencer marketing platform in the US. [4]
- Micro-influencers generated up to 60% more engagement than their macro counterparts, highlighting their impact. [3]
- On average, 77% of influencers are female across various platforms. [13]
- 92% of marketers believe that influencer marketing is an effective form of marketing, underscoring the industry’s credibility. [17]
- TikTok, with 55.5% of marketers using it for influencer campaigns, emerged as a prominent platform for influencer collaborations. [11]
- Brands invested 10% to 20% of their marketing budget into influencer marketing in 2022. [16]
- Lifestyle influencers charge the highest, earning an average of $994 per collaboration. [13]
- 64% of companies expressed concerns about fraud in influencer marketing. [11]
- Nano-influencers (<10k followers) share sponsored posts 67% more often than mega-influencers, showcasing their high content frequency. [14]
- About 63% of marketers plan to utilize Artificial Intelligence and Machine Learning in influencer marketing in 2024. [11]
General Influencer Marketing Statistics
The influencer market has significantly grown from 1.7 billion in 2016 to 16.4 billion in 2022. [1]
The US influencer market was valued at $21.1 billion, in 2023. [1]
It is projected to grow to 24 billion in 2024. [1]
1 in 4 marketers currently leverage influencer marketing. [1]
| Year | Market Size |
|---|---|
| 2016 | $1.7 billion |
| 2017 | $3 billion |
| 2018 | $4.6 billion |
| 2019 | $6.5 billion |
| 2020 | $9.7 billion |
| 2021 | $13.8 billion |
| 2022 | $16.4 billion |
| 2023 | $21.1 billion |
On an average, 77% of influencers are female across all platforms. [13]
Micro-Influencer Marketing Statistics
Micro-influencers (those with 100,000 to 1 million followers) generate up to 60% more engagement than macro-influencers. [3]
44% of marketers said that the biggest benefit of working with micro-influencers is that it is less expensive. [2]
56% of marketers who invest in influencer marketing work with micro-influencers. [2]
Nano-influencers (<10k followers) share sponsored posts 67% more often than mega-influencers (100k+ followers). [14]
Mega-influencers (100k+ followers) share 27% more video content than those with less than 50k followers. [14]
Influencer Marketing Usage Statistics
47% of influencers refer to themselves as ‘creators’, 8% refer to themselves as ‘influencers’, and 45% use both the above terms interchangeably. [15]
There is a sizable amount of increment in influencer content, as agreed by 78.5%. [11]
How do influencers work?
81% of influencers work solo while, 7% work with other freelancers. [15]
2% of influencers work with full-time employees and 10% outsource some of their tasks. [15]
Is Influencer Marketing Statistics Effective?
Do you trust influencers?
Statistics suggest, most people do!
50% of Millennials trust product recommendations from influencers. [18]
It is interesting to note that comparatively only 38% for product recommendations from celebrities. [18]
92% of marketers believe that influencer marketing is an effective form of marketing. [18]
33% of Gen Zs have bought a product based on an influencer’s recommendation in the past three months. [18]
Which Social Media Platforms Are Preferred For Influential Marketing?
An average influencer monetizes two social platforms. [13]
Which social media platforms do you use? Who are your favorite influencers?
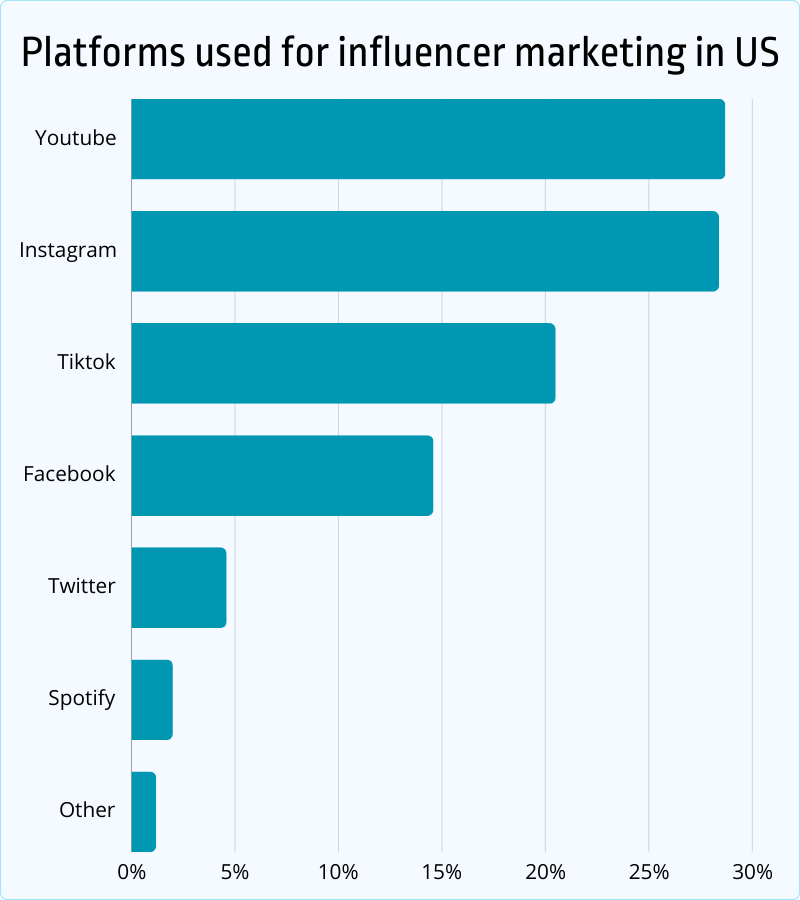
Source: Statista
Influencer Marketing On YouTube
- 38.3% of marketers use YouTube for influencer campaigns. [11]
- 28% of US consumers reported following at least one virtual influencer on YouTube. [7]
- Dance, music, and gaming were the most popular categories for YouTube influencers in 2021. [8]
- YouTube micro-influencers have the highest engagement rates on the platform. [9]
- In 2021, YouTube was the most popular platform to watch gaming influencers for users in the US and Great Britain. [10]
Influencer Marketing On Instagram
Guess which platform credits the highest return on investments?
Instagram!
- 50.8% of marketers use Instagram for influencer campaigns. [11]
- Instagram was the most-used influencer marketing platform in the US in 2022. [4]
- 72% of marketers used Instagram for influencer campaigns in 2022. [4]
- 32% of businesses agreed that it’s the easiest platform for working with influencers. [4]
- Lifestyle and beauty were the most popular categories among global Instagram influencers in 2021. [5]
- There were 3.8 million posts tagged with #ad on Instagram in 2021. [6]
- 79% of Instagram influencers are female.
Influencer Marketing On TikTok
- 55.5% of marketers use TikTok for influencer campaigns. [11]
- 45% of paid collaborations take place on TikTok. [11]
- 68% of influencer marketers plan to utilize TikTok. [13]
- The average price per post from a TikTok mega-influencer was $1,034 dollars in 2021. [7]
Influencer Marketing On Facebook
- 42.1% of marketers use Facebook for influencer campaigns. [11]
- Influencer videos accounted for 60% of video views on Facebook in the US in 2022. [12]
- According to the Social Media Marketing Benchmark Report, the most common types of posts on Facebook are now link posts (49.2%), followed by photo posts (30.8%), video posts (17.7%), and status posts (2.3%). [12]
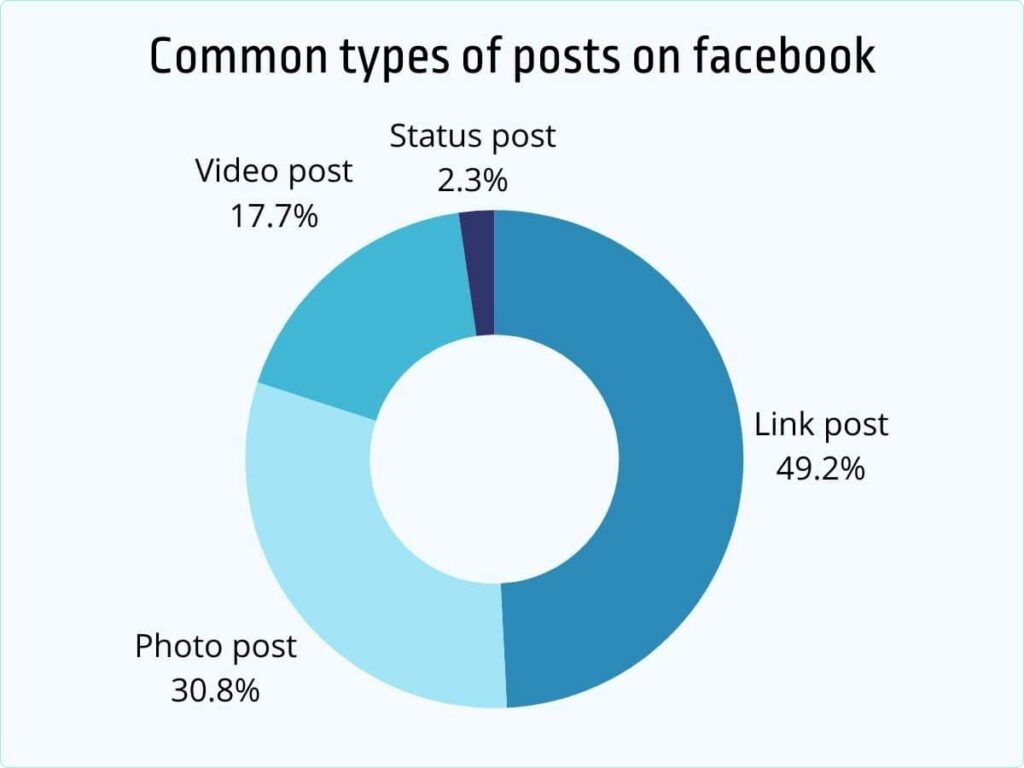
Source: Social Media Marketing Benchmark Report
Snapchat was the least popular social media platform, with 73% of brands planning to utilize it the least. [13]
Twitter was the second most unpopular, with 58% of surveyed brands saying they planned to utilize it the least. [13]
Pinterest was the third in the list of most unpopular. [13]
Influencer Marketing Budgets Statistics
In 2022, 39% of marketers invested 10% to 20% of their marketing budget into influencer marketing. [16]
In 2022, influencer marketing spending jumped from 3.69 billion to 4.14 billion in the U.S. [16]
On average, businesses generate $6.50 in revenue for every $1 invested in influencer marketing. [17]
Source: Influencer Marketing Hub
How much do influencers change?
Influencers are quite rich, right?
Let’s see how much influencers ask for on various platforms.
- YouTube influencers take about $791 per collaboration, on average. They ask more than other platforms. [14]
- TikTok influencers ask for $460 per collaboration, on average.
- User-generated content (UGC) creators ask for $396 per collaboration, on average.
- Instagram influencers ask for $363 per collaboration, on average.
What do they actually end up earning?
- Brands end up paying $418 to YouTube influencers per collaboration, on average. [14]
- Brands end up paying $203 to TikTok influencers per collaboration, on average.
- Brands end up paying $227 to UGC influencers per collaboration, on average.
- Brands end up paying $183 to Instagram influencers per collaboration, on average.
Most Lucrative Influencer Niches
Wondering which are promising influencer niches?
- Lifestyle influencers charge $994 per collaboration. [13]
- Health & fitness influencers charge $979 per collaboration.
- Comedy & entertainment influencers charge $968 per collaboration.
- Travel influencers charge $939 per collaboration.
- Food & drink influencers charge $918 per collaboration.
- Fashion influencers charge $912 per collaboration.
- Model influencers charge $864 per collaboration.
- Beauty influencers charge $860 per collaboration.
- Music & dance influencers charge $850 per collaboration.
- Art & photography influencers charge $818 per collaboration.
Is AI & ML Impacting Influencer Marketing?
The use of Artificial Intelligence and Machine Learning has been increasing in recent years.
When asked, “Are you planning to utilize AI and ML in 2024 to identify influencers or create effective campaigns?”
63% of marketers said they will utilize AI & ML in influencer marketing. [11]
27.1% are not sure, while 9.9% are against the idea. [11]
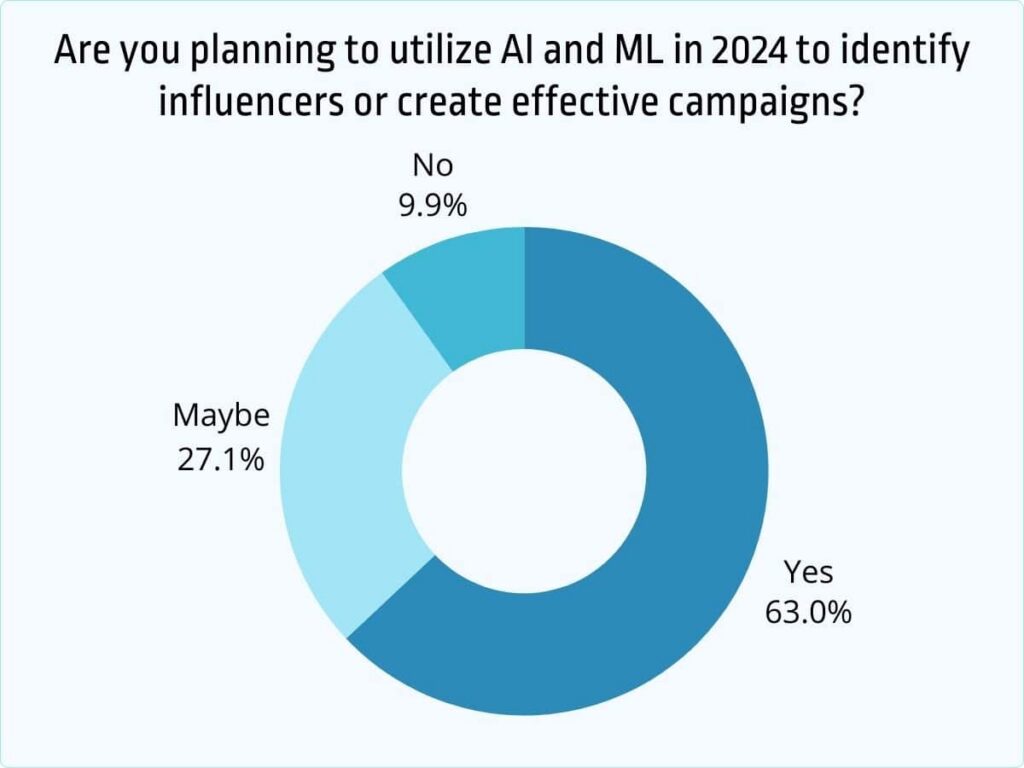
Source: Influencer Marketing Hub
Top Challenges In Influencer Marketing
- One of the top challenges in Influence marketing is frauds in the industry. [11]
- 64% of companies are concerned about fraud within the influencer marketing industry. [11]
- Despite the fact that the number of influencers are drastically increasing, 18% of brands find discovering relevant influencers difficult. [11]
- 22% of brands found scaling their marketing campaigns as one of the most difficult part of influencer marketing. [15]
- 16% of brands said it is challenging to maintain good partnerships with influencers. [15]
If you found this article interesting, you might enjoy these too:
FAQs
How much has the influencer market grown in recent years?
The influencer market grew from $1.7 billion in 2016 to an impressive $16.4 billion in 2022.
What percentage of influencers are female across all platforms?
On average, 77% of influencers are female across various platforms.
What is the benefit of working with micro-influencers?
The biggest benefit of working with micro-influencers is their cost-effectiveness, as stated by 44% of marketers.
Which is the most lucrative niche for influencers?
Lifestyle influencers charge the highest, earning an average of $994 per collaboration.
How do influencers navigate challenges related to fraud in the industry?
Influencers employ authenticity verification tools and collaborate with reputable influencer marketing platforms to mitigate fraud risks. Such proactive measures contribute to building trust with both brands and followers.
How has the COVID-19 pandemic affected influencer marketing trends?
The pandemic accelerated influencer marketing, with a surge in online activities. Brands embraced influencers for authentic connections in the virtual landscape, leading to a substantial shift in marketing dynamics.
Conclusion
In the dynamic realm of influencer marketing, the numbers speak volumes. Trust in influencers is solid, with 92% of marketers deeming influencer marketing effective. Instagram rules the influencer marketing space, but TikTok is swiftly gaining ground.
In the era of Artificial Intelligence, about 63% of marketers plan to harness technology for impactful campaigns. The influencer marketing journey is a fascinating blend of numbers, niches, and ever-evolving trends.
Sources
- Statista. Influencer marketing market size worldwide from 2016 to 2024
- Hubspot. Benefits of Influencer Marketing
- Emplifi. Micro-influencers vs. macro-influencers: Who’s best for your marketing efforts?
- Statista. Leading platforms used by marketers for influencer marketing in the United States from 2020 to 2025
- Statista. Distribution of Instagram influencers worldwide in 2022
- Statista. Number of #ad posts on Instagram in 2020 and 2021
- Statista. Leading platforms where consumers follow virtual influencers in the United States as of March 2022
- Statista. Distribution of YouTube influencers in the United States in 2021, by category
- Statista. YouTube influencer engagement rates worldwide in 2023, by follower count
- Statista. Share of internet users following video gaming streamers and influencers on selected online platforms
- Influencer Marketing Hub.The State of Influencer Marketing 2024: Benchmark Report
- Statista. Distribution of Facebook video views in the United States between January and July 2022, by creator category
- Aspire. State of influencer marketing 2023
- Emplifi. State of influencer marketing 2023
- Creator IQ & Tribe Dynamics. Influencer marketing trends report
- Statista. Share of marketing budgets spent on influencer marketing worldwide as of February 2024
- Convinceandconvert. Why Influencer Marketing is Creating Huge Returns for Businesses
- Pro.MorningConsult. The Influencer Report

Manisha Saini is a digital writer and career advisor at Jobera. She creates research-based content on job search trends, personal branding, and career growth, helping professionals make better career decisions.