![U.S. Paid Holiday Statistics: Navigating The Time-Off Trends [2026]](https://jobera.com/resources/wp-content/uploads/2024/02/us-paid-holidays.webp)
Are all Americans enjoying paid leave?
About 40 million Americans are not paid for holidays i.e., 1 in 4 employees do not receive paid holidays.
The average length of paid holidays is 7.6 days in the US.
Only 3% of workers receive more than 14 days of paid holidays in the US.
Did you know holidays impact your work-life balance?
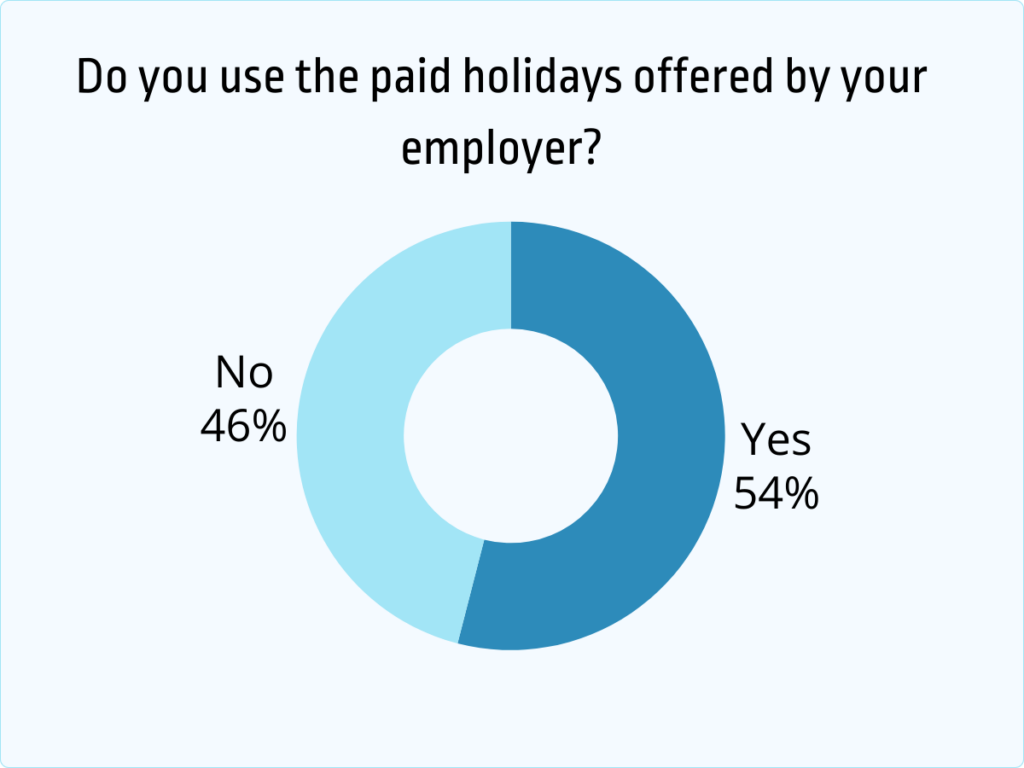
46% of employees do not use their paid holidays because they fear they have to do a lot of pending work after the holidays.
Ready for a better break? Explore revealing US paid holiday statistics and redefine your time away.
Top US Paid Holiday Statistics: Editor’s Pick
- The average length of paid holidays is six days. [2]
- Only 3% of workers receive more than 14 days of paid holidays in the US. [5]
- About 40 million Americans are not paid for holidays i.e., 1 in 4 employees do not receive paid holidays. [5]
- 32% of Americans receive a paid holiday in honor of Martin Luther King, Jr.’s birthday. [9]
- The manufacturing industry is reported to provide the best-paid holidays to 97% of its employees. [3]
- The Leisure and Hospitality industry offers the worst paid holidays with only 37% of employees in this industry getting paid holidays. [3]
- Northeastern US states have recorded a good number of paid holidays. [1]
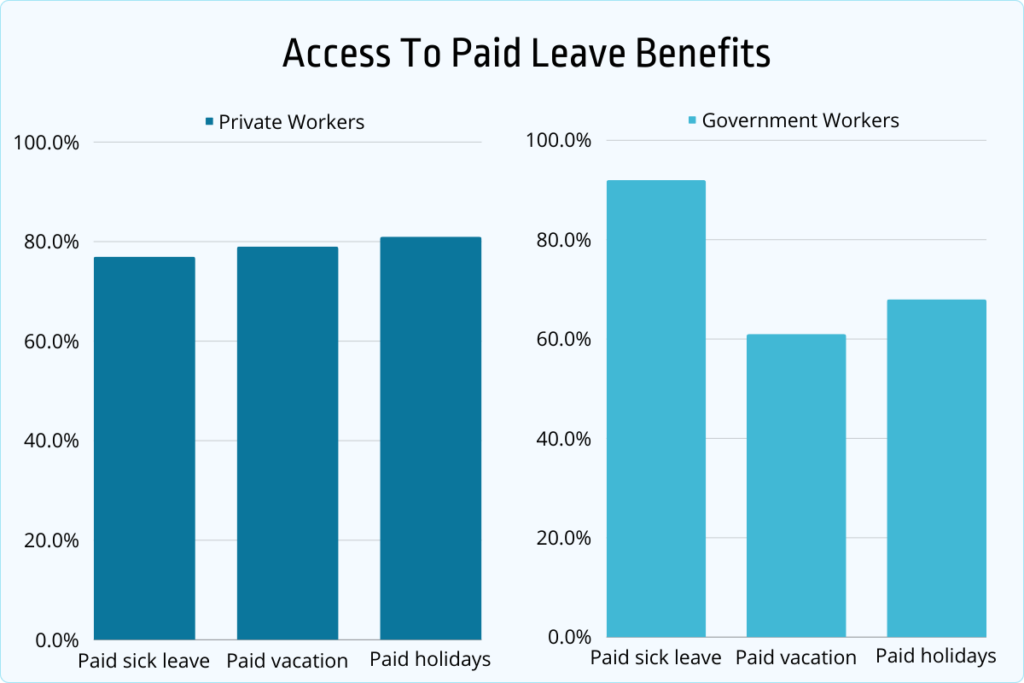
- 77% of private industry workers and 92% of state and local government workers have paid sick leave. [7]
General Paid Holidays Statistics
About 40 million Americans are not paid for holidays i.e., 1 in 4 employees do not receive paid holidays. [5]
Only 3% of workers receive more than 14 days of paid holidays in the US. [5]
It is interesting to note that 46% of employees do not use their paid holidays because they fear they have to do a lot of pending work after the holidays. [5]
How long do your paid holidays last?
The average length of paid holidays is six days. [2]
21% of US employees receive six paid holidays per year. [2]
48% of companies are reported to provide floating holidays, in which employees are allowed to take paid leave as per their choice. [4]
Popular Paid Holidays in the US
Let’s see which jobs mostly give paid holidays!
- 97% of US workers enjoy paid holidays on Thanksgiving and Christmas. [8]
- Independence Day is the next popular paid holiday, as 92% of civilian workers received paid-offs. [8]
- 91% receive a paid holiday on Labor Day. [8]
- 90% of civilian workers receive paid holiday to celebrate New Year. [9]
- 90% of all civilian workers are reported to receive a paid holiday on Memorial Day. [9]
- 32% of Americans receive a paid holiday in honor of Martin Luther King, Jr.’s birthday. [9]
According to 2023 statistics, paid holiday statistics are followed by 81% of private industry workers and 68% of state and local government workers. [7]
77% of private industry workers and 92% of state and local government workers have paid sick leave. [7]
Paid Holiday Statistics By Industry
Does your industry offer enough paid leave?
Let’s find out!
The manufacturing industry is reported to provide the best-paid holidays to 97% of its employees. [3]
IT and Finance industries also provide good access to paid holidays to their employees. Their leaves extend up to 8-9 days. [3]
The Leisure and Hospitality industry offers the worst paid holidays with only 37% of employees in this industry getting paid holidays. [3]
Here we have reviewed the average number of days and percentage of paid holidays given in an industry.
| Industry | % of employees that are offered leave | Average Number of Days |
|---|---|---|
| Manufacturing | 97% | 9 |
| IT | 97% | 8 |
| Finance Services | 94% | 9 |
| Education & Health Services | 82% | 8 |
| Trade, Transportation & Utilities | 81% | 7 |
| Business Services | 78% | 9 |
| Construction | 73% | 7 |
| Leisure & Hospitality | 37% | 6 |
Paid Holiday Statistics By Location
Europen (20) and South American countries have more average paid leaves than US (7.6). [1]
Finland employees receive up to 30 paid holidays, as opposed to the US average of 7.6 days. [1]
Northeastern US states have recorded a good number of paid holidays. [1]
Here we have listed the holidays that are usually paid holidays in every American state.
- New Year’s Day
- Memorial Day
- Independence Day
- Labor Day
- Thanksgiving Day
- Christmas Day
10th June is a paid holiday for every US state except South Dakota. [6]
Nine states including Hawaii, Delaware, Illinois, Montana, Indiana, New York, New Jersey, Rhode Island, and Pennsylvania offer paid holidays on Election Day. [6]
Some other holidays in US States are
| Holidays | States Where Holiday is Recognized |
|---|---|
| President’s Day | 41 states, excluding Wisconsin, Iowa, Kansas, Kentucky, North Carolina, Louisiana, Delaware, Rhode Island, and Florida |
| Indigenous People’s Day (Columbus Day) | 24 States, including Alabama, Arizona, Connecticut, Georgia, Idaho, Illinois, Indiana, Maine, Maryland, Massachusetts, Missouri, Montana, Nebraska, New Hampshire, New Jersey, New Mexico, New York, Ohio, Pennsylvania, Rhode Island, South Dakota, Utah, Virginia, West Virginia |
| Day After Thanksgiving | 18 states, including Delaware, Florida, Iowa, Kansas, Kentucky, Maryland, Michigan, Nebraska, New Hampshire, New Mexico, North Carolina, Pennsylvania, South Carolina, Texas, Vermont, Virginia, Washington, and West Virginia |
| Christmas Eve | 12 states, including Connecticut, Delaware, Guam, Hawaii, Indiana, Kentucky, Louisiana, New Jersey, North Carolina, North Dakota, Puerto Rico, and Tennessee. |
If you found this article interesting, you might enjoy these too:
FAQs
What is the average number of paid holidays in the US?
7.6 days is the average number of paid holidays in the US.
What are floating holidays?
Floating holidays are paid days off on employees’ choice of day.
Which industry has the highest-paid holidays?
The manufacturing industry is reported to provide the best-paid holidays to 97% of its employees.
Which industry has the lowest-paid holidays?
The Leisure and Hospitality industry offers the worst paid holidays with only 37% of employees in this industry getting paid holidays.
What are major paid holidays in the US?
These are major paid holidays in the US
- New Year’s Day
- Memorial Day
- Independence Day
- Labor Day
- Thanksgiving Day
- Christmas Day
- MLK Jr. Day
- Veterans Day
Wrapping Up
The average length of paid holidays is 7.6 days in the US. About 40 million Americans are not paid for holidays. Only 3% of workers receive more than 14 days of paid holidays in the US.
The manufacturing industry is reported to provide the best-paid holidays to 97% of its employees. IT and Finance industries also provide good access to paid holidays to their employees. Their leaves extend up to 8-9 days.
New Year’s Day, Memorial Day, Independence Day, Labor Day, Thanksgiving Day, and Christmas Day are holidays that are usually paid holidays in every American state.
Sources
- Employmentlawhandbook.com. Federal and State Holidays – Employment Law Handbook
- Clockify. What is the average PTO in the USA? Key PTO statistics for 2023
- en.wikipedia.org. Holidays with paid time off in the United States – Wikipedia
- statista.com. Percentage of U.S. workers, by number of paid holidays 2020 | Statista
- SHRM. Employees Say Support For Their Well-Being Falls
- Office Holidays. Columbus Day by state
- Bureau of Labor. Workers in the private industry received an average of 8 paid holidays in 2017
- VacationTracker. Leave Management Report for 2023 | 50+ Paid Time Off (PTO) Statistics
- Forbes. Average PTO In The US & Other PTO Statistics (2024)

Manisha Saini is a digital writer and career advisor at Jobera. She creates research-based content on job search trends, personal branding, and career growth, helping professionals make better career decisions.