

![150+ Workplace Injury Statistics, Facts and Trends [2026]](https://jobera.com/resources/wp-content/uploads/2023/11/workplace-injuries-stats.jpg)
Stressed by your job?
Overexertion, fatigue and back pain becoming routine? You may be surprised to know how many others suffer from workplace injuries and illnesses.
On top of this, workplace injuries can lead to heavy expenses in terms of medical claims and lost work days.
This article highlights interesting facts about workplace injuries and illnesses. You will find which injuries are most common, what are their costs and how to prevent them.
Top Workplace Injury Stats – Editor’s pick
- The ILO estimates that 340 million workplace injuries occur annually affecting 160 million workers worldwide. [1]
- The National Safety Council reports that an employee is injured every 7 seconds. [2]
- Workplace injuries can lead up to 7 million missed work days annually. [3]
- The construction industry witnesses the highest number of accidents and injuries. [1]
- Workers above 60 and below 25 are the most vulnerable to workplace injuries across all industries. [1]
- According to Travelers Injury Impact report, overexertion was the leading cause of workplace injuries in 2023. [3]
How frequent are workplace injuries?
Workplace injuries range from equipment malfunction to stress and anxiety. Therefore, it is expected that many of us suffer from workplace injuries and illnesses.
The following section illustrates how common workplace injuries are and how they affect employees worldwide.
- More than 1 million workers experience back injuries, according to the U.S. Bureau of Labor Statistics. [4]
- According to the ILO, 2.3 million workers suffer workplace injuries every year. [1]
- The United States records almost 4.7 million injured workers per year. [5]
- In 2021, the total deaths from work injuries amounted to 5190 in the United States. [6]
- This marks an 8.9% increase from previous years. [6]
- The US Bureau of Labor Statistics states that the fatal work injury rate is 3.6 fatalities per 100,000 full-time equivalent workers. [6]
- This rate was 3.4 in 2020, and 3.5 in 2019 (before COVID). [6]
- The fatality rate of 3.6 in 2021 was the highest recorded since 2016. [6]
- Australia recorded a fatality rate of 1.4 over the period 2018-2022. [7]
- This amounts to an average of 180 employee deaths per year. [7]
- The fatality rate among senior employees is 4 times higher, reaching 6.2 fatalities per 100,000 workers. [7]
- The lowest fatality rate recorded in Australia was 1.1, recorded in 2018. [7]
- Employees in their first year comprised 34% of workplace injuries. [7]
- Britain recorded a total of 1.8 million work-related health cases in 2021/22. [8]
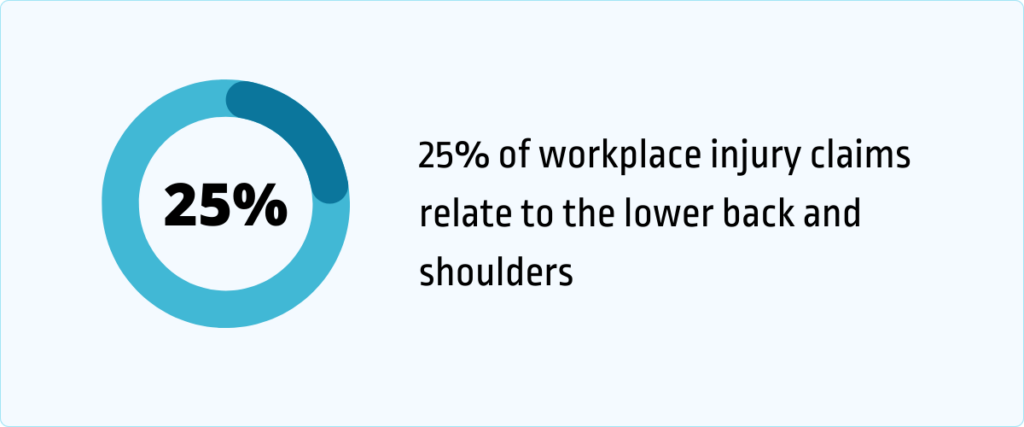
- 25% of workplace injury claims relate to the lower back and shoulders. [3]
- According to the American Journal of Industrial Medicine, workers older than 65 are more susceptible to disabilities or death resulting from workplace injuries. [9]
- It is reported that 17% of severe injuries in workers of age 55 and above lead to early retirements. [10]
- Women form a higher proportion of deaths resulting from roadway accidents and harmful exposures in the workplace. [11]
- Men, on the other hand, have a higher rate of deaths resulting from falls and contact with objects and equipment, according to the Bureau of Labor Statistics. [11]
- Over the last ten years, Australia has recorded 1850 fatalities resulting from traumatic work injuries. [7]
- Moreover, there have been over 1 million serious workers’ compensation claims filed over this time period. [7]
- This figure amounts to almost 1 in 12 workers filing these compensation claims. [7]
- All of these 1 million claims involve more than one week of working time lost. [7]
- According to the Australian health ministry, 62% of worker fatalities occurred among employees aged 45 or above. [7]
If you found this article interesting, you might enjoy these too:
- 32+ Company Culture Statistics, Trends and Facts [2026]
- 35+ Workplace Diversity Statistics, Trends and Facts [2026]
- 41+ Facts and Statistics about Workplace Violence [2026]
- 41+ Latest Workplace Conflict Statistics, Trends and Resolutions [2026]
- 21+ Workplace Distractions Statistics: Why Can’t We Focus at Work? [2026]
What causes workplace injuries?
Most of us think of heavy equipment and car accidents when we think of workplace injuries. However, illnesses and injuries can result from many different factors.
In fact, some of the most common causes of workplace injuries involve burnout and overexertion, something all of us can relate to.
- Due to COVID, the most common cause of workplace injury in 2020 was exposure to harmful substances, resulting in 36% of workplace injuries. [2]
- The industry affected most by exposure to harmful substances was healthcare service. [2]
- Before the pandemic, exposure to harmful substances was ranked as the 6th most common cause. [2]
- Workers lost an average of 13 days from injuries caused by exposure to harmful substances. [2]
- Disregarding the COVID effect, the two leading causes of workplace injury are overexertion, and slips and falls. [2]
- Overexertion resulted in almost 22% of workplace injuries in 2020. [2]
- Workers lost almost 14 days due to injuries from overexertion. [2]
- The industry affected the most by overexertion injuries was transportation and warehousing. [2]
- The age group most affected by overexertion injuries was 45 to 65 year-olds. [2]
- The third most common cause for workplace injuries was reported to be slips and falls, resulting in 18% of cases in 2020. [2]
- This type of injury caused an average of 14 lost days. [2]
- The industries where most slips and falls occurred in 2020, were transportation and warehousing, and agriculture. [2]
- The age group most affected by slips and fall was 55 years and older. [2]
- The fourth most common cause is contact with objects and equipment, accounting for 16.7% of workplace injuries in 2020. [2]
- Typical lost days from these injuries were 14. [2]
- Explosions accounted for 3% of workplace injuries, according to a 2020 report by the US Bureau of Labor Statistics. [12]
- These injuries from explosions have the highest casualty rate. [12]
- The most expensive workplace injuries are musculoskeletal disorders and they account for 33% of workplace injuries. [12]
- The fastest growing type of workplace injury is Repetitive Stress Injury and can be caused by more than 100 different job types. [12]
- Repetitive Stress Injuries have a high chance of resulting in permanent disabilities. [12]
- Travelers Injury Impact Report found that new employees suffered the most injuries, regardless of industry. [3]
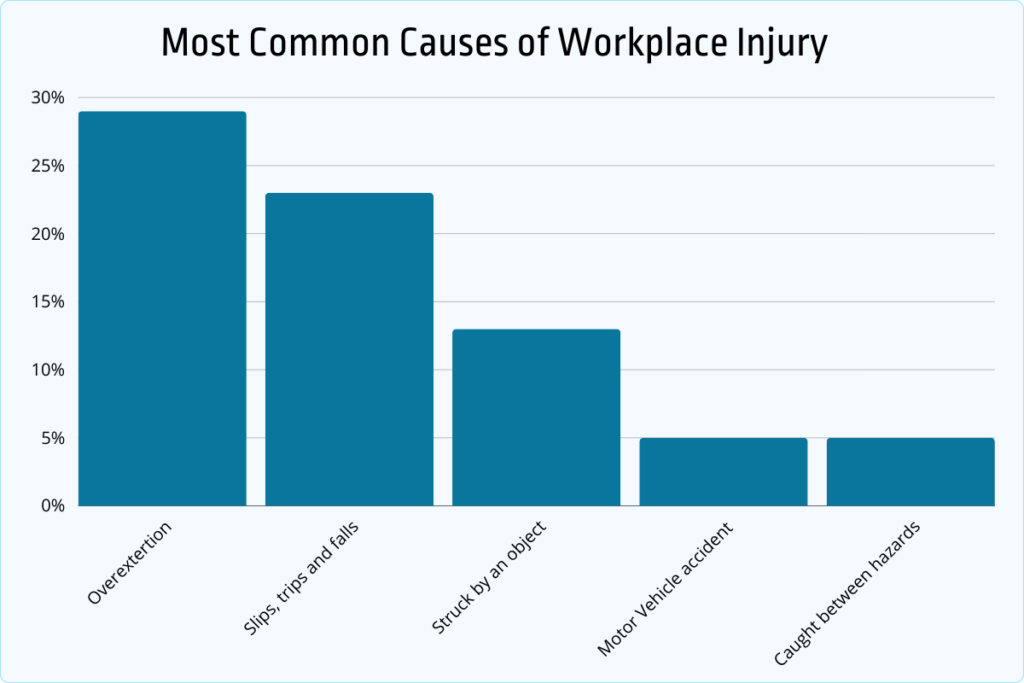
- According to this report, the top cause of accidents across all industries was overexertion (29%). [3]
- Causes next in line were slips and falls (23%), motor vehicle accidents (5%), and being caught between hazards (5%). [3]
- A total of 850 fatalities resulted from falls and slips in 2021. [3]
- In Australia, vehicle incidents accounted for 81 workers fatalities in 2022, constituting 42% of all fatalities in their period. [7]
- Being hit by moving objects was next in line, leading to 26 worker deaths, comprising 13% of all fatalities. [7]
| Type of Injury | Proportion of all claims |
|---|---|
| Sprains and strains | 38% |
| Fractures | 13% |
| Contusions | 8% |
| Dislocations | 7% |
| Inflammation | 7% |
- Britain recorded 0.9 million workplace medical cases stemming from stress, depression or anxiety in 2021/2022. [8]
- The next most common cause was musculoskeletal disorder resulting in 0.5 million workplace injuries in this period. [8]
- These injuries combined resulted in a total of 36.8 million lost working days in Britain. [8]
- 600,000 British workers held COVID responsible for causing or worsening their workplace injury in 2021/2022. [8]
- A British HSE report stated that 30% of all work-related deaths were caused by falls from heights in 2022. [8]
- This report also listed that being struck by a moving, flying or falling object resulted in 21% of all fatal injuries in 2022. [8]
- Next in line, being struck by a moving vehicle accounted for 15% of the total number of deaths from workplace injuries in 2022/23. [8]
Which industries suffer the most injuries?
Different types of jobs pose different kinds of risk to the worker. It is expected that workers in harmful jobs like construction and healthcare would be more prone to injuries.
The following facts show how workers from different industries are affected by hazards of the workplace.
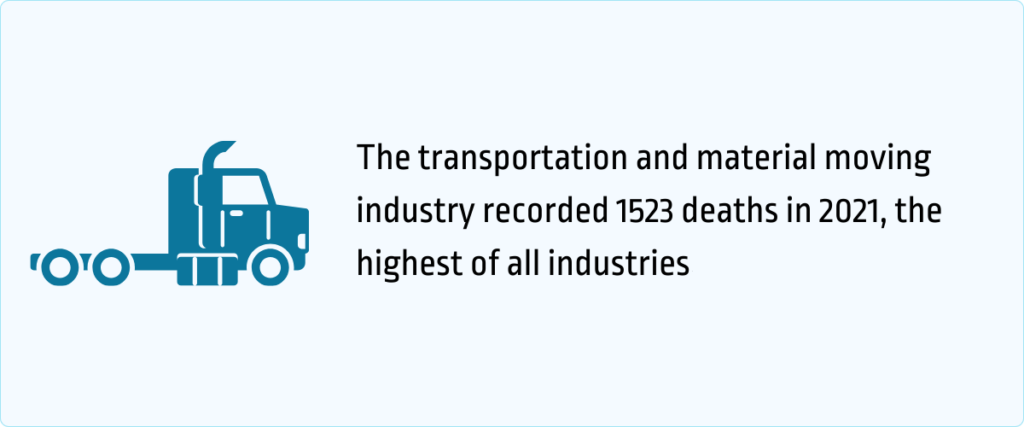
- The transportation and material moving industry experienced the highest fatalities from workplace injuries in 2021, amounting to 1523 deaths. [6]
- These fatalities comprised 38.2% of all work-related deaths in 2021. [6]
- 370 of these fatalities were due to falls, slips and trips in construction and extraction jobs. [6]
- This number marks a 7.2% increase from 2020. [6]
- The number of fatal workplace injuries for driver/sales workers and truck drivers amounted to 1032 in 2021. [6]
- The construction and extraction industry recorded the 2nd highest number of fatal work injuries, amounting to 951 deaths in 2021. [6]
- Firefighters, law enforcement, police officers and other protective service workers experienced 302 deaths from work-related injuries in 2021. [6]
- 45% of these fatalities were from homicides and suicides, while 33% were caused by transportation incidents. [6]
- Installation, maintenance, and repair occupations had 475 fatalities in 2021. [6]
- Almost 30% of these casualties were suffered by vehicle and mobile equipment mechanics, installers and repairers. [6]
- The fishing and hunting industry reported a fatality rate of 75.2 deaths per 100,000 full-time equivalent workers. [6]
- This marked an almost 50% decrease from the fatality rate of 132 in 2020. [6]
- Restaurant workers reported that 53% of their injury claims were filed by first-year employees, making it the highest proportion across all industries. [3]
- The construction industry saw 47% of injury claims filed by first-year employees, making it the second in line. [3]
- Transportation industry stands at third position, with 40% of injury claims filed by first-year employees. [3]
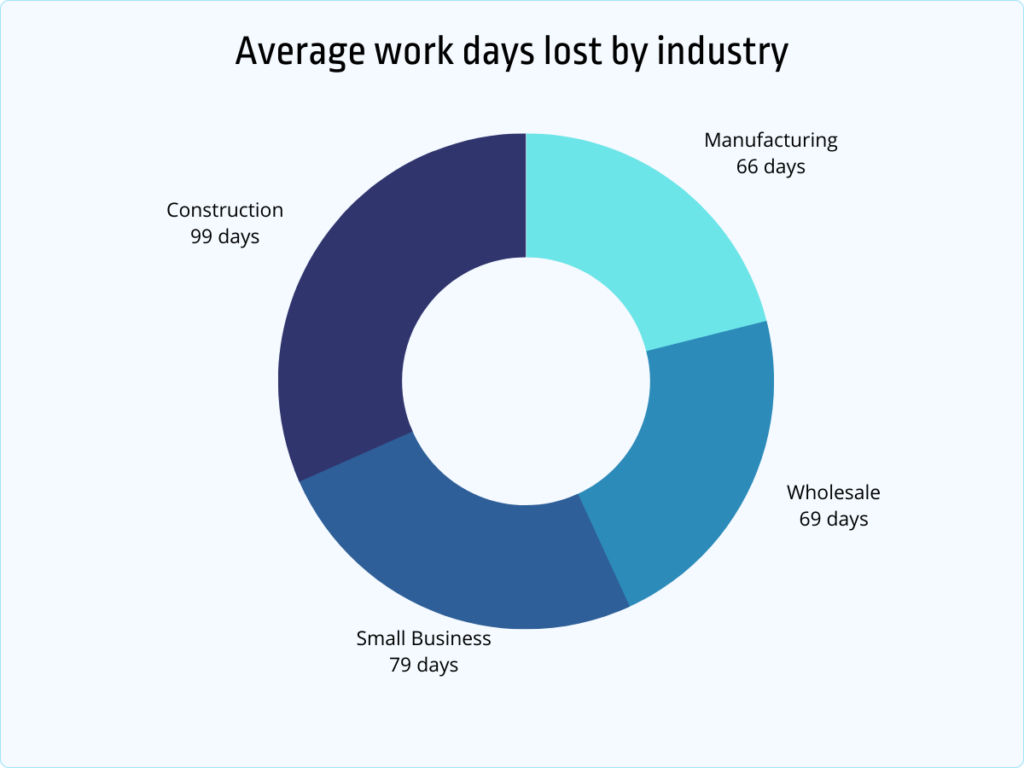
- The average work days lost per injury were the highest in the construction industry. [3]
- The healthcare industry recorded 453,200 non-fatal workplace injuries, the highest number across all industries in 2023. [9]
- The retail trade industry was second in line with 352,800 non-fatal work injuries in 2023. [9]
- The manufacturing industry trailed close behind with 334,500 non-fatal injuries. [9]
- Industries next in line were transportation and warehousing with 235,200 injuries, Accommodation and Food Services with 182,500 injuries and Construction with 162,500 injuries in 2023. [9]
- When compared with the total workforce, the highest rate of non-fatal injuries was recorded by the Transportation and Warehousing industry. [2]
- This amounted to 4.3 injuries per 100 full-time equivalent employees. [2]
- The Agriculture, Forestry, Fishing, and Hunting industry also recorded an injury rate of 4.3 for non-fatal injuries. [2]
- The Arts, Entertainment, and Recreation industry recorded the second highest rate of non-fatal injuries, amounting to 3.4. [2]
- The third highest rate of non-fatal injuries was reported by Healthcare and Social Assistance industry and Retail Trade, amounting to 3.1 injuries per 100 full-time equivalent employees. [2]
- This was followed by the Manufacturing industry with a rate of 2.8. [2]
- According to the British data, there were 68 fatalities resulting from workplace injuries in 2021/2022. [8]
- Of these deaths, 87% were from the services sector comprising retail, accommodation and food, transportation, public administration. [8]
How expensive can workplace injuries get?
Workplace injuries are not only harmful to the health of the worker, they also come with financial costs.
Data shows that absences and medical treatment can lead to heavy costs both for the employer and the employee.
These lost days and medical bills also affect the overall economy and labor market of countries, as shown by the following statistics.
- Injuries related to back pain cost employers $7 billion annually and result in 100 million lost work days. [12]
- The average cost per injury is higher for older employees. [3]
- Costs of medical claims filed by senior employees are 15% higher compared to injury costs of middle-aged employees. [3]
- Compared to employees aged 18-24, the injury costs of senior employees were 140% higher. [3]
- These figures are especially alarming because of the growing number of older people in the workforce. [3]
- According to the US Bureau of Labor Statistics, workers aged 65 or above will account for 60% of the growth in the workforce in the next ten years. [13]
- Injuries caused by slips and falls have the highest average cost per claim. [3]
- Workers injured due to slips and falls in the workplace lost an average of 83 days. [3]
- Vehicle accident injuries rank 2nd highest in terms of average cost per claim. [3]
- Injuries caused by vehicle accidents resulted in an average of 79 absences per worker. [3]
- Dislocations were rated the most expensive work injury, followed by fractures as the second most expensive. [3]
- The Australian health ministry estimates that work-related injuries and illnesses result in an average loss of $28.6 billion per year. [7]
- If workplace injuries are prevented, the Australian economy could gain an extra 185,500 full-time equivalent jobs per year and an average wage rise of 1.3%. [7]
- Medical claims filed by female employees result in an average loss of 8.8 weeks and the same figure for male workers is 7.6 weeks. [7]
- However, the average compensation rate for women stands at $14,604 compared to $16,476 for men. [7]
- This difference results from factors like the nature of injury, the types of jobs that women and men are more likely to work in, and differences in pay. [7]
- In 2021, work-related injuries resulted in 3.65 million absences in British Columbia, Canada. [14]
- The most common types of injuries reported in British Columbia were strains (19,953), back strains (10,631), occupational disease (7,724), cuts (4,560) and contusions ( 4,176). [14]
| Type of accident | Average cost per accident |
|---|---|
| Motor Vehicle Accidents | $85,311 |
| Burns | $54,173 |
| Falls | $48,575 |
| Caught By/Between Objects | $44,588 |
| Struck By Object | $39,977 |
| Type of accident | Average cost per injury |
|---|---|
| Amputation | $118,837 |
| Fracture or Dislocation | $60,934 |
| Other Trauma | $60,228 |
| Burns | $48,671 |
| Infection or Inflammation | $37,498 |
| Sprain or Strain | $33,589 |
| Carpal Tunnel Syndrome | $33,477 |
| Lacerations, Punctures, and Ruptures | $33,348 |
| Concussions | $33,151 |
| Occupational Diseases and Degeneration | $16,696 |
How to prevent workplace injuries?
Prevention is one of the best strategies to deal with workplace injuries. Companies and governments try to enforce safety standards and protocols to prevent casualties at work.
Data shows that prevention strategies are effective in reducing workplace injuries.
- Occupational Safety and Health Administration (OSHA) states that workplace injuries can be prevented by adopting its hazard communication standards. [12]
- Precautions have helped reduce daily occupational fatalities from 38 per day to 15 per day over the last 50 years. [15]
- OSHA also recommends that material safety data sheets for chemicals should be made readily available and protective equipment should be prioritized. [12]
- In British Columbia, the Prevention Services wrote 55,385 inspection reports and 32,368 health and safety orders, in 2021. [14]
- They also imposed 359 penalties, amounting to a total value of $7,895,572. [14]
- This outreach helped them serve 263,292 registered employers and 2.49 million workers, in more than 500,000 workplaces. [14]
- These prevention strategies were welcomed by employers, and 81% of employers rated their experience as ‘good’ or ‘very good’. [14]
- Employees also appreciated these efforts, and 82% of injured workers rated their experience as either ‘good’ or ‘very good’. [14]
- Engineers at West Virginia University are using camera robots to identify and warn employees about hazards on the floor that could lead to slips and falls. [9]
- Other companies like The Nationwide insurance company, Swiss Re Reinsurance Solutions and CompScience have teamed up to use AI-powered tools to prevent workplace injuries. [9]
- These solutions include using AI to analyze workplace videos to detect previously unreported workplace risks and prevent accidents. [9]
- The insurance company Chubb is using smartphone apps, wearables and drones to promote workplace safety, provide guidance for hazardous material and evaluate risk levels. [9]
- According to the Australian health ministry, the rate of fatalities has seen a decreasing trend since 2007. [7]
FAQs
What is classified as a Workplace Injury?
Any injury or illness that occurs as a result of work-related activities. These injuries can happen in various settings, including offices, factories, construction sites, and other work environments. Workplace injuries can be classified into several categories:
Physical Injuries: These include cuts, bruises, fractures, sprains, strains, burns, and amputations.
Occupational Illnesses: Some injuries or illnesses may develop over time due to exposure to hazardous substances or unsafe working conditions. Examples include respiratory conditions, skin diseases, and hearing loss.
Repetitive Strain Injuries (RSIs): These injuries occur due to repetitive motions or overuse of a particular part of the body. Common examples include carpal tunnel syndrome, tendonitis, and bursitis.
Slips, Trips, and Falls: Wet or uneven surfaces, inadequate lighting, and cluttered walkways contribute to these incidents.
Machinery and Equipment Accidents: This category includes incidents such as getting caught in machinery, being struck by objects, or falling from heights.
Psychological Injuries: Mental health issues, such as stress, anxiety, and depression, can also result from work-related factors.
Do I still get paid if I am injured at work?
This depends on several factors, including the nature of the injury, the country or region you’re in, and the specific workers’ compensation laws that apply. Here are some general principles:
Workers’ Compensation: There are workers’ compensation programs in place to provide benefits to employees who are injured on the job. These benefits typically include coverage for medical expenses, rehabilitation costs, and a portion of lost wages.
Statutory Sick Pay or Short-Term Disability: In some places, there may be statutory sick pay or short-term disability benefits available for employees who are unable to work due to illness or injury, including those sustained at work.
Long-Term Disability Insurance: For injuries that result in long-term disability, some employees may have long-term disability insurance coverage. This type of insurance may provide financial support for an extended period.
How do you deal with a workplace injury?
Remember that the specific steps and procedures may vary based on your location and workplace policies. Here are some general guidelines:
- Seek Immediate Medical Attention
- Notify Your Supervisor or Employer
- Document the Incident
- File a Workers’ Compensation Claim
- Stay in Communication with the relevant authorities
If in doubt, consult with your human resources department or seek legal advice to ensure you are following the appropriate procedures for your situation.
Conclusion
Workplace injuries and illnesses impact millions of workers worldwide. The International Labor Organisation estimates that workplace injuries result in 6000 global deaths per day.
These injuries are caused by manufacturers, with overexertion being the most common cause. Overexertion accounts for 20 to 30% of all workplace injuries.
Other common causes include slips and falls, motor vehicle accidents, and being struck by an object.
Workplace injuries can cost up to 100 million lost work days annually. These injuries can be prevented by adopting safety standards and protocols.
Sources
- International Labor Organization. The enormous burden of poor working conditions.
- National Safety Council. Top Work-related Injury Causes.
- Travelers. 2023 Travelers Injury Impact Report.
- Legal Zoom. Workplace injury: What to do if you are injured on the job.
- Pulpstream. The 6 Steps to Handle a Work Injury Correctly
- US Bureau of Labor Statistics. Census of Fatal Occupational Injuries Summary, 2021.
- Safe Work Australia. Key Work Health and Safety Statistics Australia, 2023.
- HSE. Health and safety at work Summary statistics for Great Britain 2022.
- SHRM. New, Older Workers Stand Out in Workplace Injury Data.
- PubMed. Differential underestimation of work-related reinjury risk for older workers: Challenges to producing accurate rate estimates.
- Work Injury Source. 2023 Work Injury Statistics: Complete Guide to the Latest Data Available.
- Thomas Marschee. Top 5 most common workplace injuries and how to avoid them.
- US Bureau of Labor Statistics. Projections overview and highlights, 2020–30.
- Work Safe BC. Statistical overview for 2021.
- Complete Care. 7 of the Most Common Work-Related Injuries.
[ratemypost]