![50+ Latest Fintech Statistics and Trends [2026]](https://jobera.com/resources/wp-content/uploads/2024/03/fintech.webp)
Ever questioned the impact of fintech on your wallet?
The fintech industry is currently worth about $226.76 billion, projected to reach $917.17 billion by 2032.
Digital payment holds the largest fintech market share, constituting 25% of the market.
Did Covid disrupt fintech adoption and growth?
No! Actually what happened was the opposite.
The pandemic saw an average increase of 47% in gross values transacted for retail-facing fintech firms.
Venture capital investment in fintech reached $122.9 billion in 2021, doubling between 2020 and 2021.
Ready to dive deeper? Here are the latest fintech statistics and trends you need to know.
Top Fintech Statistics: Editor’s Pick
- The global fintech market is expected to grow at a CAGR of 23.58% from 2021 to 2025. [7]
- 64% of the global population used at least one fintech app in 2019. [5]
- Digital payment is considered the biggest fintech product holding 25% of the fintech market. [4]
- According to the latest statistics, the fintech industry is worth about $226.76 billion. [12]
- Fintech is expected to reach $917.17 billion by 2032, growing at a CAGR of 16.8%. [12]
- Global fintech industry revenue has nearly doubled from $90.5 billion in 2017. [13]
- The global funding value stood at $113.7 billion in 2023. [20]
- Visa is the largest fintech company by market cap. [23]
General Fintech Statistics
64% of the global population used at least one fintech app in 2019. [5]
Digital payment is considered the biggest fintech product holding 25% of the fintech market. [4]
The global fintech market is expected to grow at a CAGR of 23.58% from 2021 to 2025. [7]
AI is one of the leading technologies in the fintech market, with a market share of about 38.25%. [7]
Blockchain technology is growing with $70 to $75 million in 2018, with a CAGR of 50% in the next six years. [8]
Regtech was worth about $120 billion in 2020 with a CAGR of 52.8%. [11]
What Is The Size And Worth Of The Fintech Industry?
- The global financial sector was expected to be worth $26.5 trillion in 2022 with a CAGR of 6%. [1]
- It is interesting to note that the fintech market share across 48 fintech unicorns is now worth over $187 billion (as of the first half of 2019) which is slightly over 1% of the global financial industry. [2]
- In 2022, the global financial services market received over $25 billion in funding. [6]
- 60% of credit unions and 49% of banks in the US state that fintech partnerships are important. [3]
- Up to 28% of banking and payment services are at risk of disruption due to new fintech business models. [9]
- Companies that use automation for banking tasks reported getting returns on investment of 100% within three to eight months. [10]
- According to the latest statistics, the fintech industry is worth about $226.76 billion. [12]
- Fintech is expected to reach $917.17 billion by 2032, growing at a CAGR of 16.8%. [12]
- Global fintech industry revenue has nearly doubled from $90.5 billion in 2017. [13]
Fintech Market Share By Regions
In the US and Canada, the biggest fintech segment is digital payment, valued at over $1.2 trillion in 2021. [21]
There were 8,775 fintech startups in America in 2021. [21]
Asia-Pacific fintech startups were numbered at 4,765 in 2020. [22]
Europe, the Middle East, and Africa had a combined total of 7,835 fintech startups in 2020. [22]
By the end of 2024, China and the US are estimated to account for more than 61% of the global fintech transaction value. [21]
Fintech Investment Statistics
The fintech industry investments have nearly reduced to half in 2023. [14]
Here we have reviewed the growth of investments in fintech over the last decade:
| Year | Value of Investments |
|---|---|
| 2010 | $9 billion |
| 2011 | $6 billion |
| 2012 | $4 billion |
| 2013 | $18.9 billion |
| 2014 | $51.2 billion |
| 2015 | $64.9 billion |
| 2016 | $73.7 billion |
| 2017 | $59.2 billion |
| 2018 | $148.6 billion |
| 2019 | $216.8 billion |
| 2020 | $123.3 billion |
| 2021 | $225.8 billion |
| 2022 | $196.6 billion |
| 2023 | $113.7 billion |
The total value of investments into fintech companies worldwide increased drastically between 2010 ($9 billion) and 2019 ($216.8 billion). [20]
The highest value of investments was seen in 2021 (225.8 billion). [20]
The global funding value stood at $113.7 billion in 2023. [20]
Impact of Covid on Fintech
Did the fintech industry saw a downfall during Covid, like other industries?
Not really! Situations were a bit different for fintech.
Almost every type of fintech vertical (digital lending, digital payments, or insurtech) grew in the first half of 2020. [18]
Retail-facing fintech firms saw an average increase of 47% in gross values transacted in 2020. [18]
Digital payment and digital lending firms saw the largest growth during the pandemic. [18]
Globally, 55% of the people who used digital payments during the pandemic were lower-income. [18]
It is reported that the use of fintech apps in Europe rose by 72% due to lockdown orders that attempted to limit the spread of Covid. [19]
Fintech And AI Statistics
About 90% of global fintech companies are using AI. [15]
B2B businesses are 24% more likely to use AI content generation tools compared to B2C. [15]
The insurance industry is estimated to save about $1.3 billion via AI. [16]
AI or machine learning fraud detection algorithms are estimated to minimize the time of fraud investigations by 70% while increasing accuracy by 90%. [17]
VC Fintech Funding Statistics
Venture capital investment has gone up to $40 billion per year. [24]
The largest portion of fintech VC funding was carried out in the US. [24]
Capital markets received the largest number of VC funding ($8.07 billion) in the last few years. [25]
Next in line to receive VC funding is the payments sector with $6.03 billion. [25]
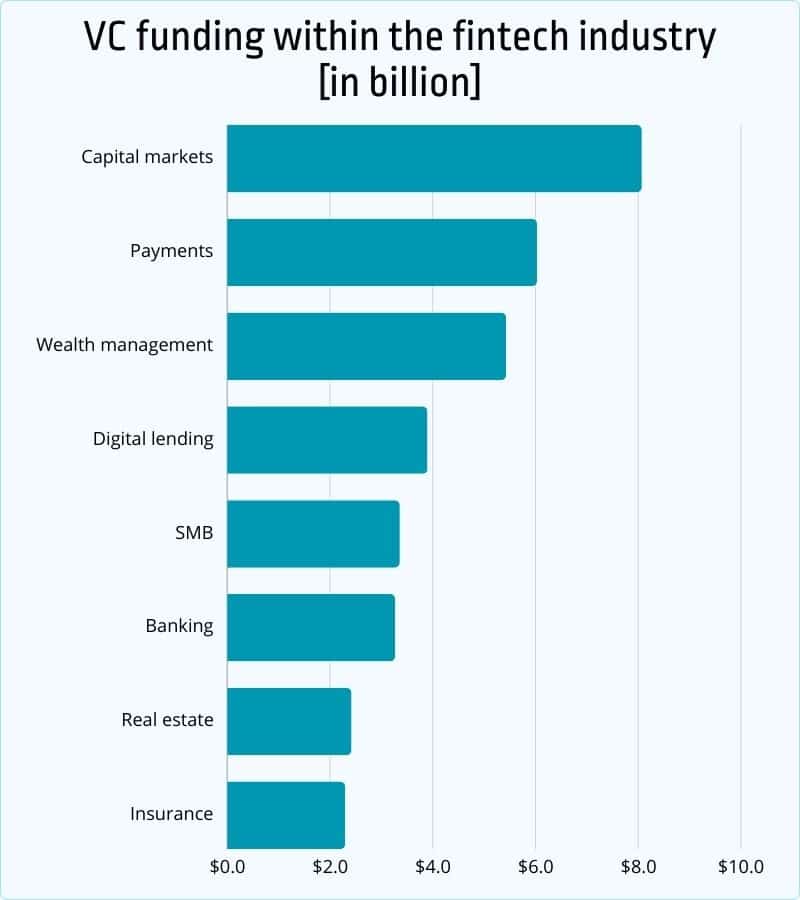
Source: CB Insights
The overall VC funding in fintech has more than doubled between 2020 and 2021. [24]
In 2014 the VC funding in fintech was $8 billion. [24]
2015 saw a significant rise of $17.3 billion. [24]
Fintech received $49.9 billion in VC funding in 2020. [24]
The first half of 2023 received $27.3 billion in VC funding. [24]
| Year | VC Funding | No. of deals |
|---|---|---|
| 2014 | $8 billion | – |
| 2015 | $17.3 billion | – |
| 2016 | $20.4 billion | – |
| 2017 | $23.4 billion | 2,348 |
| 2018 | $53.2 billion | 3,226 |
| 2019 | $45.6 billion | 3,650 |
| 2020 | $49.9 billion | 3,995 |
| 2021 | $122.9 billion | 6,623 |
| 2022 | $88.3 billion | 6,128 |
Leading Fintech Companies
Largest fintech company?
Who made it to the list?
Visa is the largest fintech company by market cap. [23]
Followed by mastercard with a $389 billion valuation. [23]
Almost half of the top 20 fintech companies by market cap are based in the US. [23]
According to recent reports, here is the list of top 20 fintech companies by their market value:
| Rank | Company | Country | Market Cap |
|---|---|---|---|
| 1 | Visa | United States | $555 billion |
| 2 | Mastercard | United States | $428 billion |
| 3 | Intuit | United States | $184 billion |
| 4 | Tencent | China | $139 billion |
| 5 | Fiserv | United States | $87 billion |
| 6 | Ant Financial | China | $79 billion |
| 7 | PayPal | United States | $64 billion |
| 8 | Adyen | Netherlands | $50 billion |
| 9 | Stripe | Ireland | $50 billion |
| 10 | Nubank | Brazil | $42 billion |
| 11 | Square | United States | $41 billion |
| 12 | Coinbase | United States | $34 billion |
| 13 | Chime | United States | $25 billion |
| 14 | Polygon | India | $20 billion |
| 15 | Revolut | United Kingdom | $20 billion |
| 16 | Ripple | United States | $15 billion |
| 17 | UIPath | Romania | $15 billion |
| 18 | Blockchain.com | Luxembourg | $14 billion |
| 19 | Grab | Singapore | $15 billion |
| 20 | Plaid | United States | $13.4 billion |
Fintech Consumer Adoption Statistics
Have you adopted fintech in your lives?
- 90% of Chinese citizens use fintech banking, payment, and financial management solutions. [26]
- US personal loan agreements using fintech have increased by 33%. [27]
- China led the way in terms of fintech banking and payment adoption in 2019 with 92%. [27]
- Between 2013 and 2018 there was a year-over-year growth from 5% to 38%. [28]
- As of 2022, about 65.3% of the US population uses digital banking. [28]
If you found this article interesting, you might enjoy these too:
FAQs
How much of the global population used at least one fintech app in 2019?
Approximately 64% of the global population used at least one fintech app in 2019.
Which fintech product holds the largest market share, and how much is it?
Digital payment holds the largest market share, constituting 25% of the fintech market.
What was the global funding value for fintech in 2023?
The global funding value for fintech stood at $113.7 billion in 2023.
What percentage of the US population uses digital banking as of 2022?
As of 2022, approximately 65.3% of the US population uses digital banking.
How does the consumer adoption of fintech vary globally?
90% of Chinese citizens use fintech banking, payment, and financial management solutions. In the US, personal loan agreements using fintech have increased by 33%, showcasing diverse adoption trends globally.
Conclusion
The fintech industry continues its remarkable growth, driven by digital payments, AI integration, and a surge in global adoption. Despite the challenges posed by the Covid pandemic, fintech not only weathered the storm but flourished, particularly in areas like digital payments and lending.
As venture capital funding reaches unprecedented levels and the industry landscape evolves, key players like Visa, Mastercard, and others are shaping the future of finance.
Sources
- Marketscreener. US $26.5 trillion in 2022
- Cbinsights. Global fintech report
- Finances online. 81 Key Fintech Statistics 2024: Market Share & Data Analysis
- McKinsey & Company. Cutting through the noise around financial technology
- EY. Eight ways FinTech adoption remains on the rise
- Report linker. Worldwide Monetary Systems Overview: Projections for 2023
- Research and Markets. Global Fintech Market 2020
- IndustryArc. FinTech Market – Forecast (2021 – 2026).
- PwC. Financial Services Technology 2020 and Beyond
- Fortunly. 45 Blockchain Statistics & Facts That Will Make You Think: The Dawn of Hypercapitalism
- Grand View Research. RegTech Market Size, Share & Trends Analysis Report
- EMR.Global Fintech Market Size
- Deloitte. Financial Service Report
- SPGlobal. Pulse of fintech 2021
- Siege Media. 155 Must-Know Content Marketing Statistics for 2024
- Juniper Research. Premiums to Grow by 1,500% over Next 5 Years
- The Business Research Company. AI in Fintech
- Weforum. Global COVID-19 FinTech Market Rapid Assessment Study
- Forbes. Coronavirus Drives 72% Rise In Use Of Fintech Apps
- Statista. Value and number of investments in fintech worldwide from 2010 to 2023
- Statista. FinTech Report 2021
- Statista. Number of fintech worldwide from 2018 to 2024, by region
- CFTE. Largest Fintech Companies 2024
- Statista. Value and number of venture capital (VC) investments in fintech worldwide from 2014 to 2023
- CB Insights. State Of Fintech Q1’21 Report: Investment & Sector Trends To Watch
- Assets. Global FinTech Adoption Index 2019
- Statista. Share of personal loans granted in the United States from 2013 to 2018
- Capgemini. World Retail Banking Report 2018

Manisha Saini is a digital writer and career advisor at Jobera. She creates research-based content on job search trends, personal branding, and career growth, helping professionals make better career decisions.